For sub-states, such as Chicago, no public data are made to be comparable to the nation. For local employers or governments, national or state economic data is often too broad or dated to provide the basis for useful analysis. Most timely local information focuses on the labor market and hence cannot accurately reflect the level of regional economic activities. To fill this void, REAL has created a statistical index, called as the Chicago Business Activity Index (CBAI), in the fall of 2002 that, from readily available data, estimate the change in Chicago’s economic activity, in a timely and comprehensive manner. Similar to national coincidence index, the CBAI is a monthly statistics, measuring local business cycle status by leading 2-to-3 months ahead, of the six-county Chicago region.
The derivation of CBAI is based on local data and, as a national factor, Chicago Fed National Activity Index (CFNAI). The CFNAI is the same index of national economic activity developed by Stock and Watson in their 1999 article, providing a single, summary measure of a common factor in national economic data. Stock and Watson found that this single index constructed from the first principal component of 85 economic series forecast inflation and overall economic activity as well as or better than other models. The basic idea behind the local index is that given the CFNAI and local economic indicators, we extract local and national dynamic factors applying partitioned regression and principle component method to this data set. After that, we generate local economic activity combining national component with local dynamic factors. A REAL’s working paper by Park, Seo and Hewings (2002) describes the full context of this approach.
It is well known that regional economy fluctuates according to more factors than those of national economy, since nation-wide case can ignore regional shocks through aggregation whereas regional economy moves following both nation-wide factors and local factors. In order to identify national components and local components, we need lots of data including regional, neighborhood states’ and nation-wide data. In capturing aggregated national fluctuation as an economy-wide factor, the CFNAI is a time saver for national data collection. Also, Forni & Lippi (1997) argues that one or two principle components can almost explain the variance of local indicators caused by economy-wide business fluctuation. Based on this proposition, we make local economic activity index as the following way: We first extract national-wide components from local indicators by using the CFNAI and get local-shocks-composed indicators. Then we apply the principle component method to those indicators. Finally we create a local economic activity index by combining CFNAI and local components. Among the three monthly indices we generated, the CBAI shall be the most useful single indicator, while the rests are related to production and real income.
Data and Interpretation
This subsection briefly describes how the forecasting system is organized. The index (CBAI) is designed to be compatible with the national coincidence index, which reflects national business cycle status. NBER has announced every month the Experimental Coincident Index (XCI) which is developed by Stock and Watson. The XCI is a contemporary index, while the local CBAI leads the local business cycle by 2-to-3 months, because its derivation relies on CFNAI. The CFNAI is a more comprehensive measure of national business cycle, being six months ahead, and the first principle component of a data set containing 85 economic indicators. The local data we used to derive principle components with CFNAI are as follows: Chicago Fed Midwest Manufacturing Index (CFMMI), Chicago Manufacturing Employment (MFGNS), Chicago Non-manufacturing Employment (NMFGNS), Illinois Total Construction (ILCONS), Chicago Retail Sales (RETAILS) and Illinois Personal Income (PI). All economic indicators are seasonally adjusted and monthly based, while PI is at quarterly.
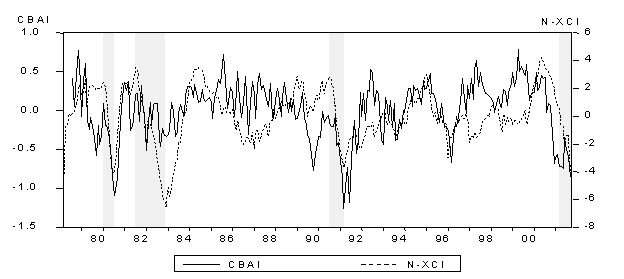
The Graph shows normalized Chicago Business Activity Index and normalized Hodrick-Prescott trend filtered XCI (N-XCI). In fact, the movements of non-smoothed local index show more noises than N-XCI, reflecting the properties of local data, including many local shocks and thereafter, the CBAI is a smoothed series of 6-month moving-averaged. Comparing the two on the graph, CBAI matches to turning points of national business fluctuations after the end of 1970s. However, CBAI moves somewhat differently from N-XCI in the middle of expansion phases and contraction phases. This reflects the fact that if there is big national economic shock, its effect dominates local shocks but otherwise, local shocks strongly affects on the local business activities. In practical points of view, the CBAI can be interpreted as follows. If CBAI goes to the points of higher than +0.2, then, in two-to-three month later, Chicago region’s economy shows boom. On the other hand, if the CBAI goes down to the points of less than -0.7, then recession will start. Once generated, the historical and projected data for the CBAI index, along with its input variables, are transformed into graphics and displayed in the newsletters, which are available to the public for download in PDF format.
Local Business Activity Index (CBAI) and N-XCI

[1] Stock, James and Mark Watson. 1999. “Inflation Forecasting,” Journal of Monetary Economics, 44, 293-335. The generation process of the CFNAI is also shown in detail at Chicago Fed’s homepage.
[2] Park, Yangsu, John J.Y. Seo and Geoffrey J.D. Hewings, “Development of a Regional Economic Activity Index for the Chicago Metropolitan Area,” University of Illinois, REAL 02-T-05.